Anthropic adds interactive visuals to Claude conversations
Anthropic introduced a beta feature on March 12, 2026, that lets Claude create custom charts, diagrams and other visualizations within its responses. The company says the visuals can change as the conversation develops.
Key takeaways · 4
- 01
Claude can create charts, diagrams and other visuals inline, and users can ask for one directly.
- 02
Visuals are temporary and may change or disappear as the conversation evolves, unlike Anthropic’s shareable or downloadable artifacts.
- 03
At launch, Anthropic said the beta was available across all Claude plan types.
- 04
Later guidance says visuals are available on web and desktop, but do not render in Claude’s iOS or Android apps.
Visuals appear in the conversation
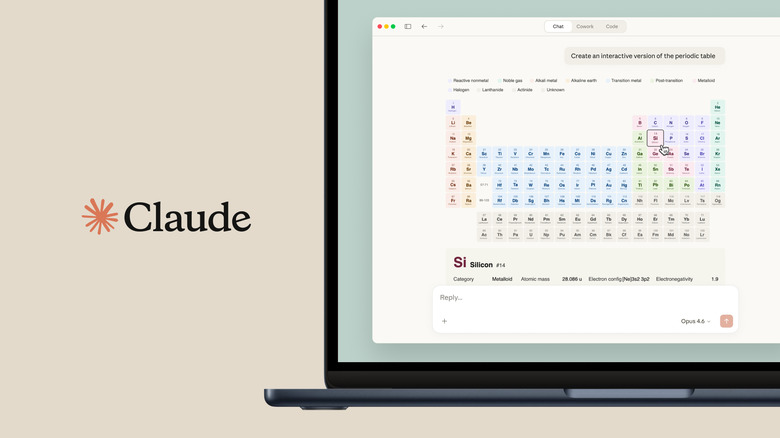
Anthropic says Claude can create custom charts, diagrams and other visualizations inline in its responses to help users understand the topic under discussion.[1] The visuals are temporary rather than a separate side-panel tool: they can change or disappear as the conversation evolves.[1] Anthropic says Claude decides when to generate one by default, while users can also request a visual—for example, by asking for a diagram or a view of change over time.[1] Afterward, users can ask Claude to adjust the visual or explore it further.[1]
Interactive, but not an image
The visuals can respond to user input: Anthropic says people can click them for more details, and its later help-center guidance describes clicking buttons, adjusting sliders and expanding a visual to full screen.[1][2] Users can also upload a CSV and ask Claude to make an interactive chart from the data.[2] Anthropic says these custom visuals are built with HTML, not presented as photos or illustrations, and can be downloaded as SVG or HTML files.[2] Its example of a compound-interest curve showed a visual users could interact with.[1]
Availability and boundaries
When it announced the beta on March 12, Anthropic said the feature was available across all Claude plan types.[1] Help-center guidance dated April 22 says custom visuals are available in beta on web and desktop, in both chat and Cowork, and do not render in the iOS or Android apps.[2] Anthropic cautions that visual quality and complexity may vary, and that Claude may not generate a visual when a user expects one.[2] The company distinguishes these temporary visuals from artifacts, which it describes as permanent tools and documents designed to be shared or downloaded.[1]
A developing interface
Anthropic had previewed Imagine with Claude the previous fall as a way to build visuals in real time without code.[1] It also says the new feature follows other changes to Claude responses, including formatted recipes and weather visuals, and that users can interact with apps such as Figma, Canva and Slack within Claude discussions.[1] The Verge reported that OpenAI had launched interactive visualizations for math and science concepts earlier in the same week, and that Google Gemini could create interactive educational images.[4] Those reports provide context, but do not establish that the products work in the same way.
For professionals who use Claude to explain data or processes, inline interactive visuals could make it easier to explore a topic without leaving the conversation. Treat the feature as an aid to exploration rather than a guaranteed output: Anthropic says quality and complexity vary, and the visuals do not render in its mobile apps.
Why it matters
Bring this to your team — one session a day, built for your industry.
kju.ai is built for teams: daily sessions, team analytics, and rollout support for your organization.
For teamsHow this developed
23 October 2026
Anthropic adds interactive visuals to Claude conversations
Sources
- Claude builds interactive visuals right in your conversation | Claude by Anthropicclaude.com
- Custom visuals in chat and Cowork | Claude Help Centersupport.claude.com
- Claude can now generate charts and diagramsengadget.com
- Anthropic’s Claude AI can respond with charts, diagrams, and other visuals now | The Vergetheverge.com